The best part of coding
03 Apr 2016
Speed. It seems like it’s all we care about. Whether it’s how long it takes for a pizza delivery to arrive or how fast a linebacker can complete the 50 yard dash, people care about things getting done in a timely fashion.
Let’s talk about speed in a programming context. Of course, we want our code to be correct and readable, however just that alone is not enough. Apps that are slow to load data can be painful to use or just flat out useless.
So let’s say you write some code and it’s really slow. How can we make it faster?
The first step is profiling. Profiling is the process of finding out what parts of your code are taking up the most time.
Let’s look at a sample Python script and profile it.
Luckily, Python provides a module called cProfile that can run our script and tell us exactly how much time each function takes. Here are the results:
ncalls  tottime  percall  cumtime  percall     filename:lineno(function)
     1    0.000    0.000    0.096    0.096     scrap.py:1(<module>)
     1    0.000    0.000    0.096    0.096     scrap.py:14(do_stuff)
     1    0.032    0.032    0.032    0.032     scrap.py:4(fast)
     1    0.065    0.065    0.065    0.065     scrap.py:9(slow) </module>
So we can see here that fast takes 0.032 seconds to execute which is roughly half the amount of time slow takes to execute at 0.065 seconds. No coincidence here since slow does twice as many operations as fast.
The only problem with the cProfile output is that it’s ugly. Who wants to spend their life looking at boring text files? I know I don’t. Wouldn’t a colorful graphical display be much nicer?
That’s where SnakeViz comes into play. SnakeViz uses something called a Sunburst chart to display profiling information in a way that pleases the eye. It’s kind of like a pie chart with layers. Let’s take a look at the Sunburst chart for my sample script…
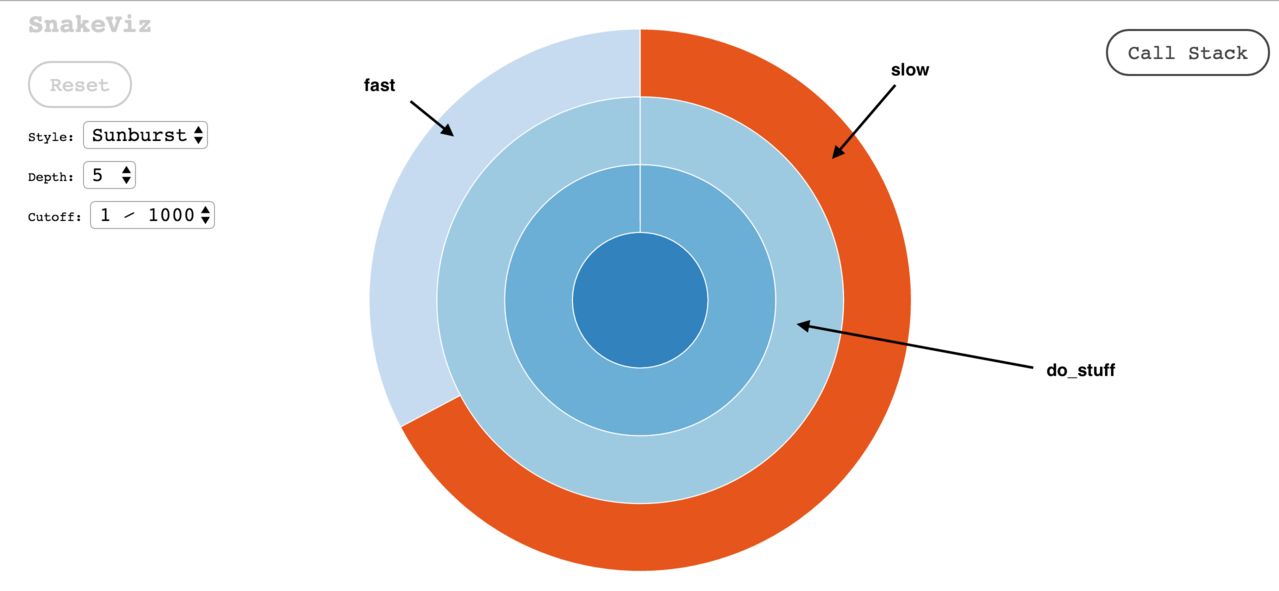
Notice that fast and slow are on the outermost layer because they don’t call any functions. On the other hand, do_stuff is on an inner layer because it makes function calls.
Now suppose that fast called another function called fastest like so…
Then our chart would look like this…
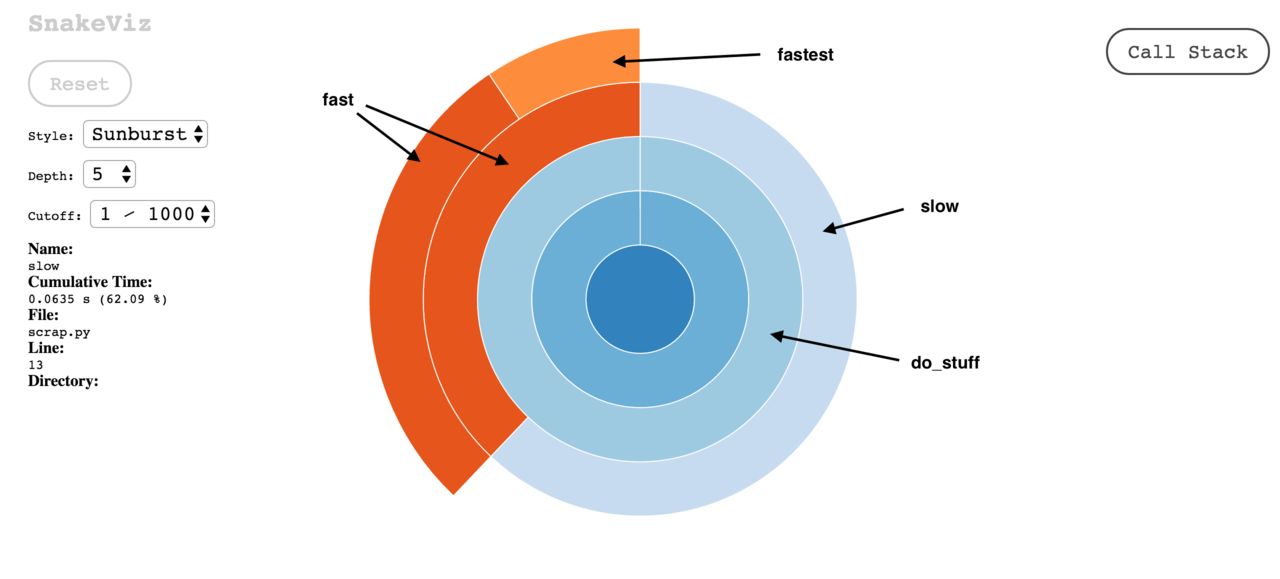
Note that fast actually has two slices. The inner slice represents the cumulative time that the function takes including all of the functions it calls.
The outer slice represents just time spent in fast without calling other functions. In other words, fast’s outer slice represents its internal time.
In summary, SnakeViz is a great tool to find out what parts of your code are taking so long. Not only is it more fun to look at than a boring text file, but it conveys profiling information much more effectively.